Monthly GADS Data Offers “Data Gold Mine” to Improve Plant Reliability.
The power industry is in a period of transformation of fuel sources and technologies, moving from large baseload coal assets to large blocks of renewable energy sources backed up by smaller, flexible natural gas fueled assets.
Due to shrinking energy margins, power plant managers today are challenged to conduct operations more quickly and efficiently with fewer resources. Fuel costs are relatively unchanged for coal and nuclear power plants, but bulk energy prices are dropping because renewable energy sources, which offer free fuel, produce at extremely low variable costs. Lower natural gas prices also contribute to lower power prices as flexible, high efficiency gas fueled plants earn market share. In addition, governments worldwide subsidize the construction of the new wind and solar farms. Once built, they are cheaper to operate than large baseload coal assets.
So how does a plant operator navigate these changes successfully? One likely opportunity that exists involves simply combining existing data in new ways. The interaction of financial, market, and reliability metrics with technology can enable better and more informed decisions.
Power plants not only generate electricity but create mountains of data on:
- Power production
- Equipment reliability
- Environmental emissions
- Costs
- Personnel data
- Number of work hours spent on tasks
Most power plant managers do not need more data. Instead, they need to know how to combine their data into metrics which provide insights to support decision making. The necessary approach is similar to the Big Data approach on customer behavior—taking seemingly unrelated data and making connections—to drive targeted sales campaigns. As an example, let’s see what can be learned from event data.
Monthly GADS Data Highlights Which Equipment Has Largest Effect on Plant Reliability
If you are operating a grid connected US asset, then you are filling out Generation Availability Data System (GADS) data monthly to meet your regulatory reporting requirements to the North American Electric Reliability Corporation (NERC) or the local Independent System Operator (ISO). Your GADS data can help you understand which pieces of equipment have the largest effect on plant reliability. Do you know how often a component fails, the average length of time required to complete a repair/replacement, or how much of your total plant capability was affected by the equipment failure or other event?
The event data entered into GADS can be a “data gold mine” when searching for how to improve plant reliability. You can combine events data into a metric that we call “Excessive Starts Ratio”, which is:
Excessive Starts Ratio = #Total Starts ÷ #of Reserve shutdowns + Planned Outages
This metric provides quick feedback on the effectiveness of operating procedures, reliability programs, and personnel training programs. If you are restarting your unit due to forced outages, operator errors, or repetitive equipment failures, the Excessive Starts Ratio will highlight the area for improvement by looking at what is causing the excessive starts.
Determining Future Market Value of Power Critical to Determine Maintenance Spending Level
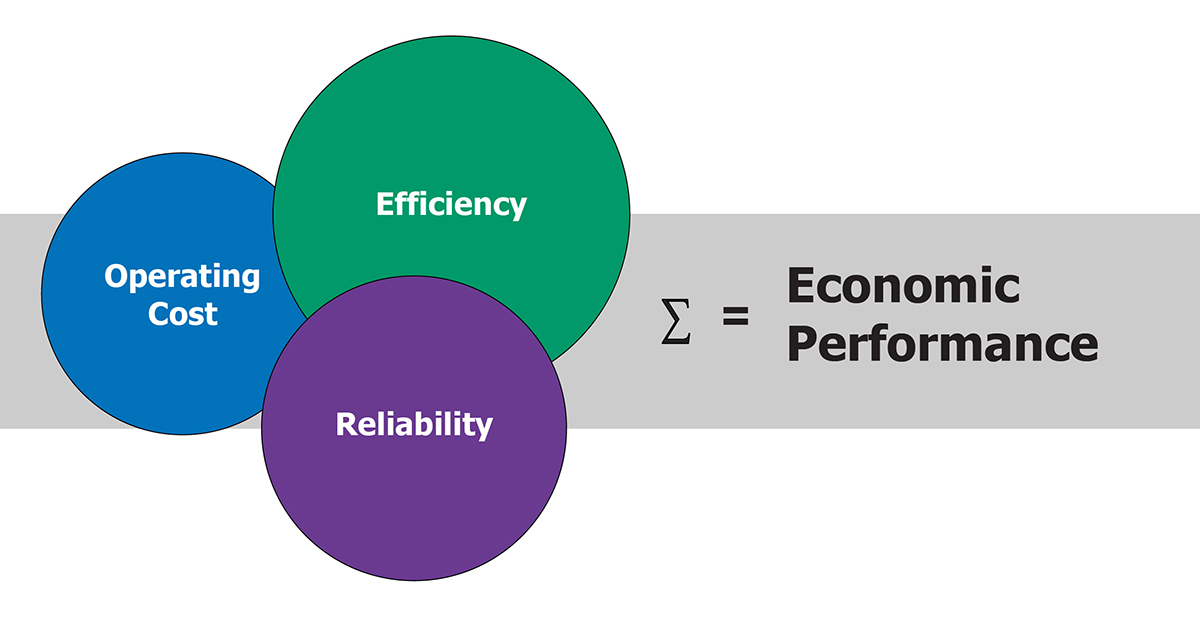
However, high reliability does not ensure commercial success. The cost required to achieve the reliability must be aligned with the market for your power. Reliability is also not free. Money must be invested in the equipment and the team operating and maintaining it to achieve high reliability. But how do you decide how much money to invest? What is the power you plan to generate in the future worth? This “expected” market value is used to determine a range of potential margins by subtracting variable production costs and required fixed costs. Some of the margin that remains can be used for discretionary maintenance spending. You can prioritize your maintenance spending by looking at past spending by component or process and compare your current spending against your weakest reliability areas.

Benchmarking Enables Operators to Identify Maintenance Spending Needs
The combining of equipment operating data, financial modeling, and market information is asset management. A key part of asset management is benchmarking or learning how your asset compares to similar assets. The percentage of your available maintenance spending allocated toward forced outages and day-to-day corrective work, compared to money spent for testing, predictive data collection, preventive maintenance and planned outages, is a good indicator of future reliability when compared through benchmarking analysis.
Using our proprietary and patented CPA™ (Comparative Performance Analysis™) tool, we can help you decide where and when to spend your maintenance money to achieve the highest commercial success. We can help you find the value hiding in your plant data.

.jpg)

.jpg)

.jpg)
.jpg)
.jpg)


.jpg)
.jpg)