.jpg)
Comparative benchmarking provides essential insight into historical operational and spending performance.
Accurate asset valuation is critical to the parties involved in any financial transaction. Although significant volumes of information may be available in the data room for analysis during a merger and acquisition (M&A) transaction, the use of in-depth comparative benchmarking data can be one of the most powerful components of the decision-making process.
By comparing the historical performance of the asset(s) relative to industry peers, detailed benchmarking data can be used to minimize assumptions throughout the due diligence process and, in turn, support effective business decisions and mitigate risk.
Financial Performance Analysis
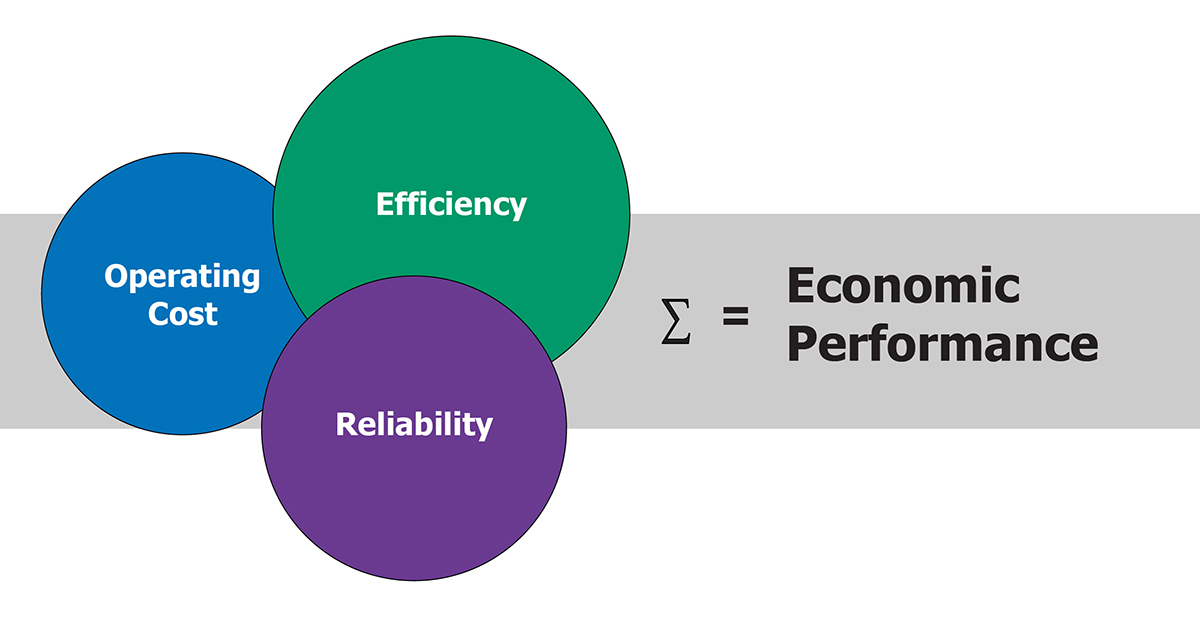
Benchmarking analysis includes extremely detailed financial data comparisons between the assets-of-interest and their industry peers. The data review process treats each unit as its own business entity, beginning with the total cash required to operate and maintain the asset. The total cost is then broken down into fixed and variable components, as shown to the right.

Operational Performance Analysis
The financial picture, however, is only part of the equation. How did historical funding impact the asset’s operational performance? This question is answered by in-depth analysis and comparison of the following operational measures:*
- Net Capacity Factor (ultimate utilization)
- Net Operating Factor (on-line utilization)
- Equivalent Forced Outage Rate
- Equivalent Unavailability
- Equivalent Unplanned Unavailability
- Net Heat Rate
*These measures are the most commonly used
Buyer’s Perspective
The buyer, when considering an asset’s value, needs to fully understand the history of funding and operational performance of the asset. Has adequate funding been applied to maintain reliability? Or has funding been restricted? Are there chronic operational issues that have not been addressed? Has operational performance been decaying (or improving) over time?
Answers to these questions lie in the data. Solomon’s patented “Maintenance Risk” methodology (which identifies maintenance effectiveness relative to both the frequency and cost of events) is an effective tool to use in such an analysis. The Maintenance Risk curve, as shown in Figure 1, includes a plot of the plant’s data relative to the its peer group (technology, size, and fuel type) and provides an effective comparison.

Figure 1. Maintenance Risk Peer Group A
Another key factor to understand is the asset’s historical start reliability. Was the unit able to stay on-line for the week following synchronization or did a forced, maintenance, derate, or start-up failure occur during the period? How did the unit compare with its peer group? Again, the answers to these questions are within the data as represented in Figure 2.
Another good indication of historical maintenance, operations, and funding is fuel conversion efficiency. Is thermal efficiency or heat rate in the expected window of the machine’s design? What has been the trend over time?
These comparative factors are a few examples of several that should be considered by the buyer to support informed decision making when considering the purchase and related purchase price of an asset.

Figure 2. Start Reliability Peer Group B
Seller’s Perspective
With the same level of importance that a buyer needs to understand the past funding and performance of an asset, the seller needs to provide accurate representation through data. Additionally, comparative indicators can be provided to support previous efforts to close performance gaps, and potentially justify a higher selling price. Figure 3 illustrates the use of data to prove the historical emphasis on the execution of planned outages and the relative decreased impact from forced outages.
Figure 4 illustrates another point of emphasis the seller may want to highlight—competitive staffing relative to its peer group. Since companies vary in philosophy regarding utilization of company and contractor personnel, the most appropriate comparison is based on “Total Effective Personnel”, which includes all personnel work hours involved in operating and maintaining the facility.

Figure 3. LRO by Outage Unavailability Type Peer Group C
Summary
Historical maintenance expenditures have a direct impact on present and future operational availability and efficiency. The insights gained through detailed financial and operational performance benchmarking analyses will yield, through the effective use of data, the relation between these key characteristics and provide an indication of future performance and potential future expenditures. The gap in performance from the peer group also helps the buyer quantify potential upside or lack thereof in improving plant operations. The benchmarking element, when added to the data room, will ultimately strengthen business decisions that are key to the M&A process. Solomon consultants each have significant experience operating, maintaining, and managing power plants. They are experts in data interpretation and understand the implications of “How Good is Good?”, as well as what potential upsides or downsides might be hiding behind the data.

Figure 4. Personnel Staffing Peer Group D


.jpg)
.jpg)
.jpg)
.jpg)

.jpg)
.jpg)